
 admin
admin Statistics is everywhere.
From medical studies and election polls to business decisions, scientific research, sports analytics, artificial intelligence, and everyday decision-making, statistics provides the language we use to understand data and uncertainty.
Yet learning statistics is often reduced to memorizing formulas:
Calculate the mean.
Find the standard deviation.
Run a test.
Construct a confidence interval.
Write a conclusion.
But real statistical thinking is much deeper.
The important questions are:
Why are we using this method?
What assumptions are required?
What does the result actually mean?
What can the data tell us—and what can it not tell us?
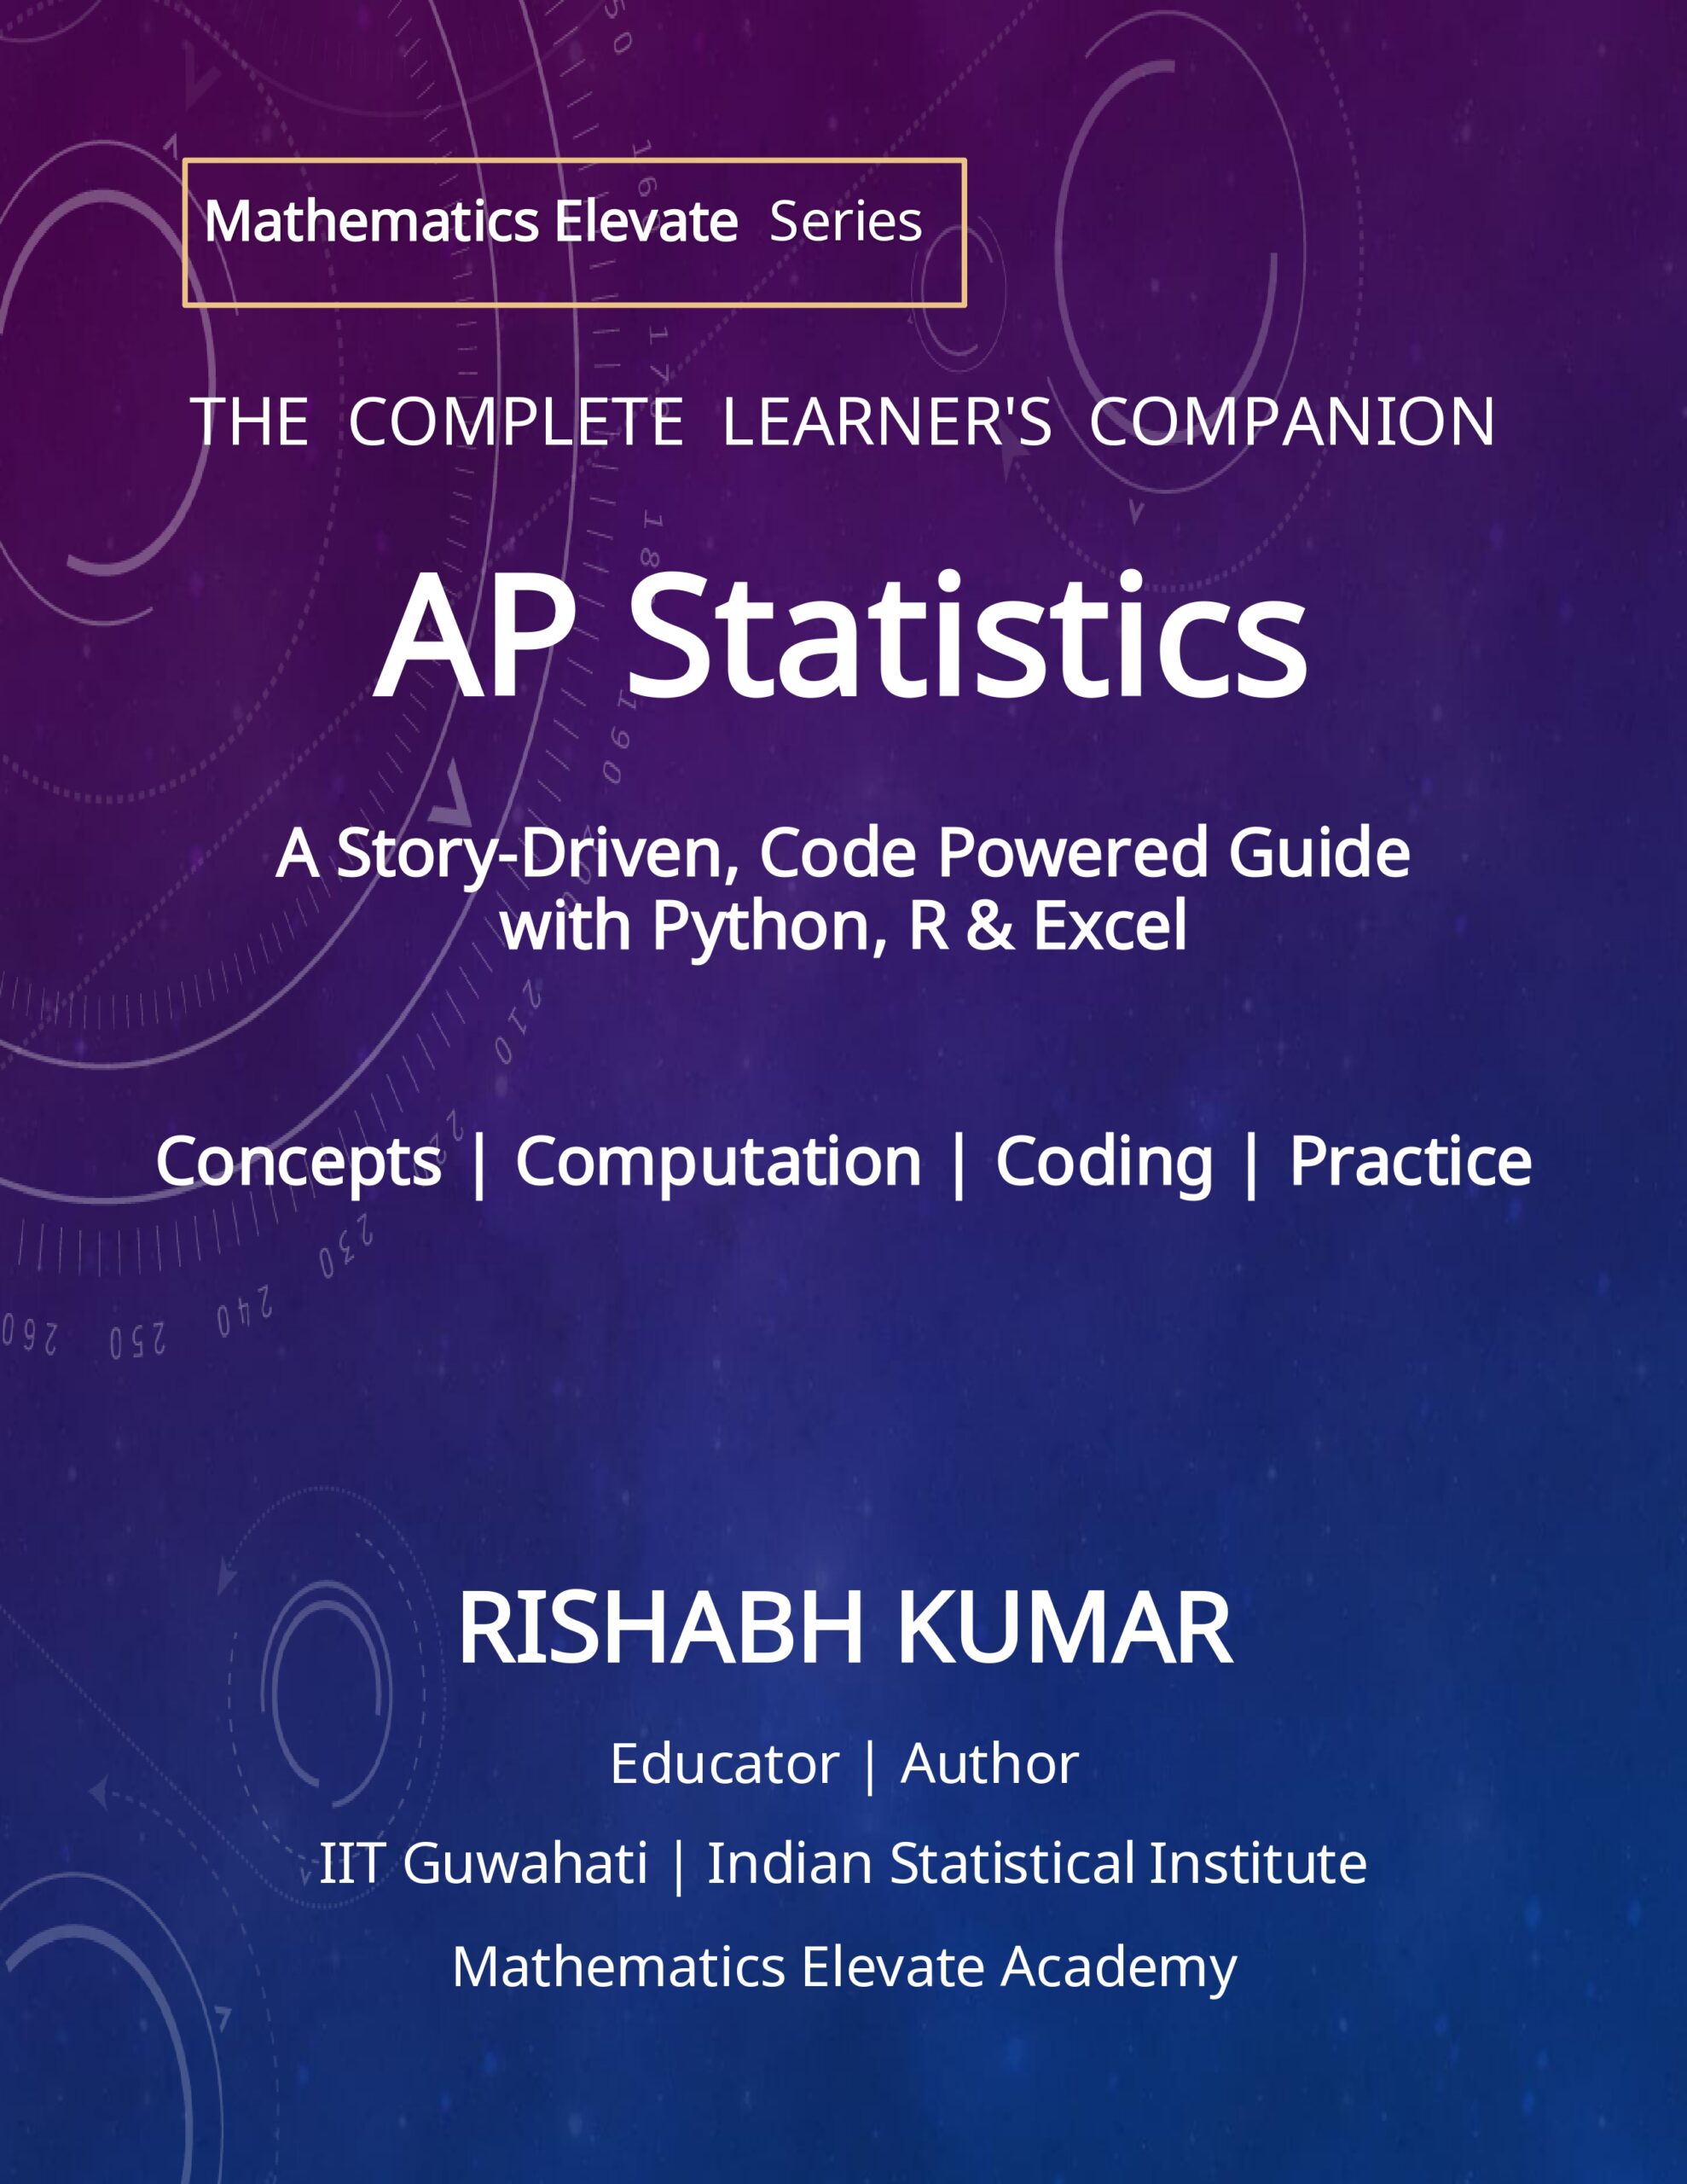
These questions are at the heart of AP Statistics: The Complete Learner’s Companion, a new comprehensive 434-page guide by Rishabh Kumar that combines AP Statistics concepts, mathematical reasoning, computational tools, practice, and examination preparation in a single learning experience.


6
Introducing AP Statistics: The Complete Learner’s Companion
AP Statistics: The Complete Learner’s Companion: A Story-Driven, Code-Powered Guide with Python, R & Excel, Practice Questions, and Mock Tests is designed for students who want to understand statistics rather than simply memorize statistical procedures.
The book follows a deliberate progression:
Concept → Mathematical Reasoning → Computation → Practice → Interpretation → Examination
This structure is particularly important because AP Statistics is not simply a computational subject.
A student may know how to calculate a statistic but still struggle to explain what it represents.
They may know how to perform a hypothesis test but fail to interpret the conclusion correctly.
They may obtain the correct output from statistical software but misunderstand what that output means.
The book therefore treats statistical reasoning and interpretation as central components of learning.
Why a Code-Powered AP Statistics Book?
Modern statistics is inseparable from computation.
Real datasets can contain hundreds, thousands, or millions of observations. Statistical software allows us to explore these datasets, perform calculations, visualize relationships, simulate random processes, and investigate statistical ideas that would otherwise be difficult to examine manually.
But technology should not replace statistical thinking.
It should strengthen it.
That is why the book integrates three widely useful computational environments:
Python
Students can use Python to explore datasets, perform statistical calculations, create visualizations, simulate probability experiments, and investigate statistical concepts computationally.
R
R provides a powerful environment specifically designed for statistics and data analysis. Learning R alongside AP Statistics gives students an early introduction to the computational language widely used in statistics, research, and data science.
Excel
Excel provides an accessible spreadsheet-based environment for calculations, data organization, visualization, and statistical exploration.
Together, these tools provide students with multiple perspectives on the same statistical ideas.
Statistics First, Technology Second
One of the guiding principles of the book is:
Technology is a tool for statistical reasoning—not a replacement for it.
A student should understand the statistical question before opening Python, R, or Excel.
For example, before performing a hypothesis test, the student should understand:
- What population is being studied?
- What parameter is relevant?
- What are the null and alternative hypotheses?
- Why is the procedure appropriate?
- What assumptions are required?
- What does the resulting p-value mean?
- What conclusion can reasonably be drawn?
Only then does computation become meaningful.
The book therefore encourages students to understand the statistical idea first and use technology to explore and implement it.
A Story-Driven Approach to Statistics
Statistics can sometimes feel abstract.
Symbols such as
can become intimidating when introduced without context.
A story-driven approach changes that.
Instead of beginning with a formula, students can begin with a question:
What happened?
What data do we have?
What are we trying to find out?
How much uncertainty is present?
What evidence would convince us?
From there, the statistical method becomes a natural response to the problem.
This approach helps students understand that statistics is not merely a collection of formulas.
It is a framework for asking questions and making evidence-based conclusions.
What Does the Book Cover?
The book provides broad coverage of the major areas students encounter in AP Statistics.
Describing Data
Students begin by learning how to organize, visualize, summarize, and interpret data.
Topics include ideas such as:
- Categorical and quantitative variables
- Graphical displays
- Measures of center
- Measures of spread
- Distribution shape
- Outliers
- Percentiles
- Standard deviation
- Comparing distributions
- Data visualization
The emphasis is on both calculation and interpretation.
Probability and Random Variables
Probability provides the foundation for much of statistical inference.
Students explore:
- Probability rules
- Conditional probability
- Independence
- Random variables
- Expected value
- Probability distributions
- Simulation
- Sampling variability
Computational tools can make probability particularly intuitive.
Students can simulate thousands of experiments and observe how theoretical probability emerges from repeated random processes.
Sampling Distributions and the Central Limit Theorem
One of the most important ideas in introductory statistics is that statistics calculated from samples themselves have distributions.
The book develops the concept of sampling distributions and explores why they matter for statistical inference.
Students encounter the role of:
- Sample size
- Sampling variability
- Standard error
- Sampling distributions
- Normal approximations
- The Central Limit Theorem
Python, R, and Excel can be used to simulate repeated samples and visually investigate these ideas.
Instead of simply being told that a sampling distribution approaches a particular shape, students can see it happen computationally.
Confidence Intervals
Statistical inference requires us to reason from samples to populations.
Confidence intervals provide a framework for estimating unknown population parameters while accounting for sampling variability.
Students develop understanding of:
- Point estimates
- Margin of error
- Confidence levels
- Conditions for inference
- Interpreting confidence intervals
- Planning sample sizes
- Comparing different confidence levels
The book emphasizes an important distinction:
A confidence interval is not simply a calculation. It is a statement about an unknown population parameter based on a sampling procedure.
Hypothesis Testing
Hypothesis testing is one of the most commonly misunderstood areas of introductory statistics.
Students often memorize:
without developing a clear understanding of what these ideas mean.
The book focuses on the reasoning behind the procedure.
Students learn to think through:
Question → Hypotheses → Conditions → Statistic → Evidence → Conclusion
Special attention is given to the interpretation of p-values and statistical significance.
Proportions and Means
The book develops inference procedures involving:
- One proportion
- Two proportions
- One mean
- Two means
- Differences between parameters
- Confidence intervals
- Significance tests
- Conditions and assumptions
- Interpretation of results
Students are encouraged to recognize which procedure is appropriate and why, rather than selecting a test solely by memorizing its name.
Chi-Square Procedures
Categorical data introduce another important class of statistical methods.
The book covers the reasoning behind chi-square procedures and their applications, including:
- Goodness of fit
- Tests of independence
- Tests of homogeneity
- Expected counts
- Chi-square statistics
- Interpretation
Again, the emphasis is not merely on obtaining a test statistic.
The student must understand what question the procedure answers.
Regression and Correlation
Relationships between quantitative variables form another major component of statistics.
Students explore:
- Scatterplots
- Correlation
- Linear regression
- Least-squares regression
- Residuals
- Residual plots
- Coefficient of determination
- Interpreting slope and intercept
- Assessing model fit
- Potential limitations of linear models
Computational tools become particularly powerful here because students can visualize data, fit models, examine residuals, and investigate how individual observations influence a model.
Statistical Conditions and Interpretation
One of the most important features of the book is its emphasis on conditions.
A statistical procedure cannot simply be applied because a formula exists.
Students must ask whether the procedure is appropriate.
For example:
- Is the sample representative?
- Are observations independent?
- Is the sample sufficiently large?
- Are expected counts large enough?
- Is the distribution approximately normal?
- Are there influential observations?
- Are the assumptions of the model reasonable?
Understanding these questions develops genuine statistical maturity.
Practice: From Understanding to Mastery
Learning statistics requires active problem solving.
For this reason, the book includes substantial practice material designed to help students move from understanding a concept to applying it independently.
A useful progression is:
Learn
Understand the concept.
Explore
Investigate the concept computationally.
Practice
Solve structured problems.
Apply
Work with unfamiliar situations.
Interpret
Explain what the statistical result means.
Test
Apply the knowledge under examination conditions.
This progression is one of the central ideas behind the book.
The Question Bank
A large question bank provides students with the opportunity to revisit concepts from multiple perspectives.
This matters because statistical understanding develops through variation.
Students should not only solve one problem involving confidence intervals.
They should encounter confidence intervals in different contexts.
They should learn to recognize the underlying structure even when the wording, data, or application changes.
The question bank is designed to support that kind of repeated and varied practice.
Mock Tests and Exam Preparation
Knowing statistics and performing well on an examination are related—but they are not identical skills.
Students also need to develop:
- Time management
- Question selection
- Accuracy
- Interpretation skills
- Strategic reasoning
- Confidence under pressure
Mock tests provide an opportunity to practice these skills.
But the most important part of a mock test is often what happens after the test.
Students should analyze:
Which questions did I miss?
Why did I miss them?
Was it a conceptual error?
Was it a computational mistake?
Did I misinterpret the question?
Did I misunderstand the statistical conclusion?
Did I run out of time?
This transforms testing into another form of learning.
How Python, R, and Excel Fit Into the Learning Process
The book does not treat Python, R, and Excel as three unrelated software packages.
Instead, they are computational lenses through which students can explore statistical ideas.
For example, a student might study a probability concept theoretically, simulate it using Python, reproduce the analysis in R, and examine the same dataset in Excel.
This reinforces the underlying statistical idea.
The software may change.
The mathematics does not.
That distinction is important.
Students should leave the book understanding that:
The goal is not to memorize commands. The goal is to understand the statistical problem.
Who Is This Book For?
AP Statistics: The Complete Learner’s Companion is suitable for several types of learners.
AP Statistics Students
Students taking an AP Statistics course can use the book as a comprehensive companion for learning, review, practice, and examination preparation.
Independent Learners
Students studying independently can use the structured progression to develop their statistical understanding systematically.
Students Interested in Data Science
Students interested in data science, statistics, economics, business analytics, machine learning, or quantitative research can benefit from the computational emphasis.
Teachers and Tutors
Educators can use the conceptual explanations, computational examples, question bank, and mock tests as supplementary teaching and assessment material.
Students Building Computational Skills
Students who want to go beyond textbook calculations and begin working with Python, R, and Excel can use the book as an introduction to computational statistics.
From AP Statistics to Data Science
AP Statistics can be much more than preparation for a single examination.
It can be a student’s first serious introduction to data-driven reasoning.
The concepts learned in AP Statistics provide foundations for areas such as:
- Data science
- Machine learning
- Econometrics
- Biostatistics
- Business analytics
- Quantitative research
- Social science
- Scientific experimentation
- Finance
- Artificial intelligence
Understanding distributions, sampling, probability, variability, estimation, inference, and regression gives students a powerful foundation for more advanced quantitative study.
A Book Built Around a Simple Philosophy
The philosophy behind The Complete Learner’s Companion can be summarized in six words:
Learn. Compute. Practice. Analyze. Test.
Learn the statistical concept.
Compute using appropriate tools.
Practice through varied problems.
Analyze the result and its meaning.
Test your understanding under realistic conditions.
This approach turns statistics from a formula-driven subject into an active process of investigation.
About the Author
Rishabh Kumar is an educator and author specializing in mathematics, statistics, and quantitative methods.
He is an alumnus of IIT Guwahati and the Indian Statistical Institute and has extensive experience teaching mathematics, statistics, and quantitative subjects to students across international curricula.
Through his teaching and writing, Rishabh focuses on making challenging mathematical and statistical ideas conceptually clear, computationally practical, and relevant to real-world problem solving.
His work emphasizes a simple principle:
Understand the idea first. Then learn how to compute it. Finally, learn how to interpret it.
AP Statistics: The Complete Learner’s Companion reflects this philosophy by bringing together statistical concepts, computational tools, practice, and examination preparation in one integrated resource.
The Book Is Now Available
AP Statistics: The Complete Learner’s Companion was published on August 26, 2026, as a 434-page paperback in an 8.5 × 11-inch format.
ISBN-13: 979-8194872275
The book is now available through Amazon US:
AP Statistics: The Complete Learner’s Companion — Amazon US
Final Thoughts
Statistics is not simply about calculating numbers.
It is about reasoning with uncertainty.
It is about asking good questions, understanding data, recognizing variability, evaluating evidence, and communicating conclusions responsibly.
And in a world increasingly shaped by data, these skills are more valuable than ever.
AP Statistics: The Complete Learner’s Companion is designed to help students make that transition—from learning statistical procedures to thinking statistically.
Whether you are preparing for the AP Statistics examination, strengthening your statistical foundation, learning Python, R, or Excel, or simply developing a deeper understanding of data, the goal remains the same:
Learn the idea. Compute it. Practice it. Analyze it. Master it.
— Rishabh Kumar
Educator · Author
Alumnus, IIT Guwahati & Indian Statistical Institute
